


Two Steps Forward, One Step Back
The last three years should reinforce for investors a timeless market lesson: stock market returns can vary sharply from one year to the next. While the S&P 500® Index, a prominent gauge of U.S. stock market performance, has averaged about 10% for nearly 100 years, stock investors who have expected a 10% return in any given year have been disappointed. In fact, the S&P 500® Index has rarely delivered a total return between 8% and 10% in any single calendar year—in almost every case it has been higher or lower, often by a substantial amount.
The last three years were a case in point. In 2020, COVID was bad, but investing was good, with the S&P 500® finishing up over 20%. 2021 produced similar results, with the S&P 500® up over 25%. Last year was a different story, with stocks entering a bear market briefly, but finishing with an 18% decline.
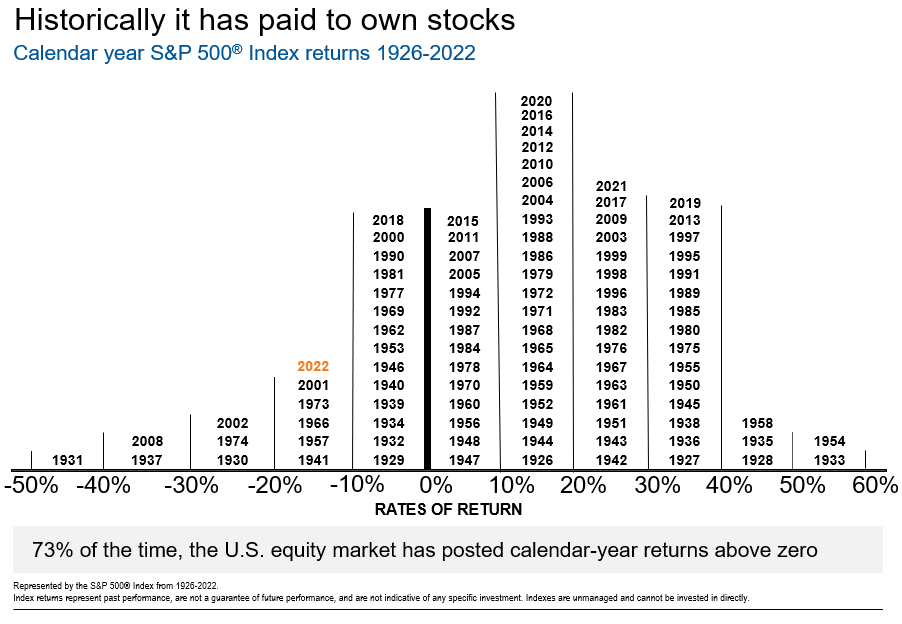
These years felt volatile but were quite representative of the history of stock returns: two steps forward and one step back. As demonstrated in exhibit 1, since 1926, stocks have been positive 70 out of 97 years (over 70% of the time), averaging just over two positive years to every negative one. Of those positive years, returns have been well above 10% more than half of the time.
Exhibit 1: S&P Historical Annual Returns in Chronological Order
This recent stretch has illustrated the importance of understanding that markets in any given year are anything but average. Knowledge of averages may tell us the central or typical value in a data series, but provide no context relative to variation, or what statisticians call standard deviation. For example, two cities may share an average annual temperature of 70˚ F, but if one is in a temperate climate where the temperature is quite steady while the other experiences significant seasonality, the average doesn’t say much about the ideal time to visit. Stocks fall into the more seasonal category, with a tendency to run hot and cold.
Consider everything investors experienced in the last three years: a global pandemic, supply chain disruptions, war in Europe, and inflation not seen in decades. It’s reasonable to feel uneasy in the face of so much uncertainty; and perhaps hard to believe that despite all that not-so-great news, the market averaged a return of 10%/year, consistent with the historical average over the past century. Of course, many investors can and should hold a much more diversified portfolio than just stocks; however, due to historically higher returns as well as fluctuations, they are often the most influential or dominant determinant of returns in an investment portfolio.
Without an understanding of historical returns in the stock market, it makes this recent stretch feel much less normal. It also makes it easy to lose sight of how to capture the long-term average return the markets have offered. The longer the holding period, the greater the odds of achieving results consistent with these averages. However, even the greatest plan is no good if you can't stick with it during down years. During this period, if you felt the need to bail out of stocks, then you probably had too much invested in them to begin with. On the other hand, if you had about the right amount, there was a good chance that you didn’t have to make any adjustments to your investments.
Putting the last three years’ stock market returns in historical perspective places them right in line with long-term averages. Two steps forward, one step back. The stock market will go up or down each year, often well above or below its average of 10%. It always has, and likely, always will. This can make the results of any given year exhilarating or disappointing, but understanding the stock market’s nature can position you to be an above average investor.